8 Essential Google Analytics Practices to Boost Your Business Performance
Table of Contents
Introduction
Data has become an important tool for business development. The more efficiently you manage your data, the better decisions you can make for your business.
Big companies use expensive professional software tools to gather and manage information about existing and potential customers and their competitors. Small businesses are coping with lighter free tools, and the most important of these is Google Analytics (GA).
Google Analytics (GA) is currently the most popular web analytics tool available to web analysts. But for many, Google Analytics is a completely new tool. In addition, people who use Google Analytics don’t know half about the tool’s new features and ways to use it effectively. More data is available for analysis than an average user can take advantage of.
This article will go through 8 important points about Google Analytics that you can easily and quickly use to improve your website’s performance and increase user flow.
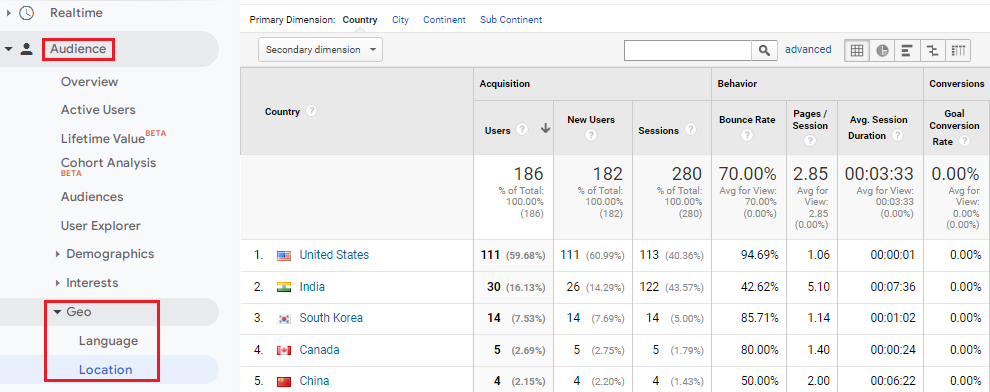
1. Is there a way to identify users who visit your site? – Audience Overview
If you try to sell to everyone, you will not sell to anyone. Before everything, you need to find your niche, your user base interested in your products, and target marketing strategies to this group of people. Everything that happens in your business should be directed only to serving this particular group of people.
With Google Analytics, you can find information about the people who visit your sites, such as their age groups, neighborhoods, and interests. And you need to use this information to create segments.
Every analysis is only as good as your hypothesis or question you ask before you dive into data. A very good characteristic of an analyst is being skeptical, which means that you verify data from multiple points of view. Always perceive the data in contexts.
Browser Language
Check what your user’s browser language is. It’s taken from browser settings, and it will tell you what your user’s native language is.
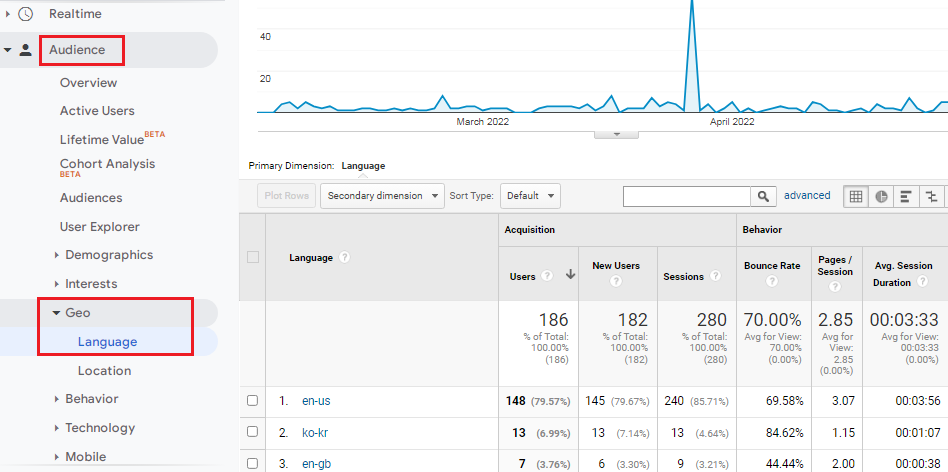
User Location
Check the top location in terms of countries, regions, cities, or how it’s divided between big and small cities/towns.
When you understand what kind of group of users you have, you will be better able to serve and target your marketing efforts to them. It saves you money on marketing costs and produces more satisfied users with a higher lifetime value (LTV), i.e., the amount of money that will come to your business in the long run.
So, have the time to research your audience and create profiles of them that you can use to plan your business.
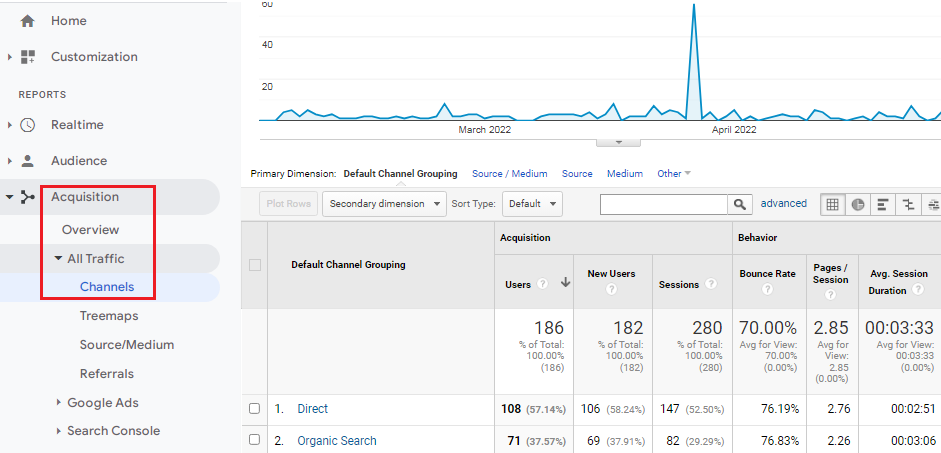
2. How do users come to your website? – Acquisition Overview
The traffic to your website will likely have the best or worse channels to discover your website. By understanding the ways your users find your site, you can better understand your users’ behavior and the effectiveness of your marketing strategies.
If most of your users come through social media, this may be because you haven’t gained enough visibility on other channels, such as search engines.
All Traffic Data
The All Traffic data under the Acquisition group are worth examining closely. The Source / Medium information pair will tell you traffic sources from other websites.
Default Channel Grouping
Don’t use only Default channel grouping. It can happen that you won’t spot potential traffic problems when using default channel grouping. For example, all paid traffic is grouped into one bucket. You don’t know if there isn’t one channel performing very well and some very bad, because you’ll see the total number for both of them.
Search Keywords
Keywords and Search Queries are two different dimensions in GA. Check if you have relevant content for keywords users are searching for. If not, create one. Don’t focus only on keywords. Search queries (as primary dimensions) are something to care about because this is what users type into the search engine.
Look for search queries that bring traffic to your website but are not related to your business. Try to exclude them from targeting in your ad settings.
If you get a surprising number of user visits through your blogs, it’s a good idea to research the traffic source and find out if new acquisitions are possible.
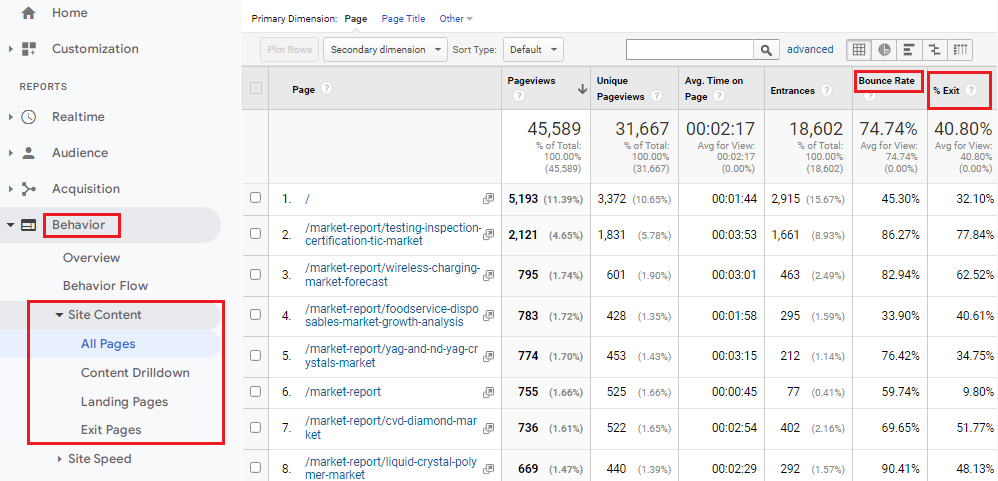
3. How do your users browse your website? – Behavior Flow
The best marketing campaign can’t produce good results if people can’t find your website when searching on search engines. That’s why the way people reach and navigate your pages is important to follow.
Navigation Summary Report
Using the Navigation Summary report, we can track our campaign pages, how users come to the page and how they behave afterward. Pages having high exit rates can be explained after looking at the page on the browsers.
Exit Rate
Analyze your pages by exit rates (weighted average). See if there is some page that shouldn’t be there as top exit pages. Every bounce is an exit, but every exit is not a bounce. Always look at the type of the page and URL and then analyze. Use navigation summary to see where the users are coming from? What are their expectations for the pages?
If you find that users regularly end up on the wrong internal pages, you should look at the internal link structure of your website. You can identify issues on your site that direct them away from the path you want.
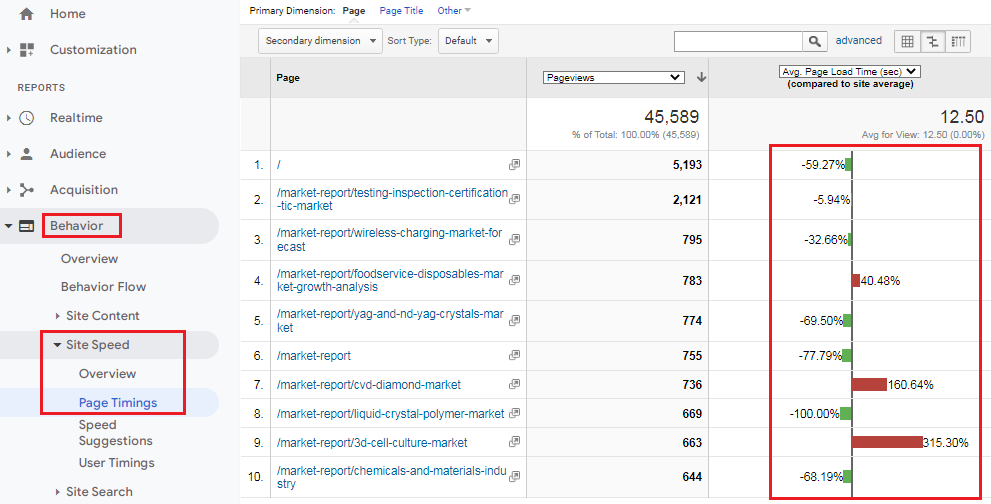
Site Speed
Site speed is very important when you think about conversions. Check if your website is performing well and focus on mobile devices’ speed and browsers. Your overall website speed might be nice, but you still might have problems with pages like the homepage of cart pages. Check if this isn’t your case. Analyze and make recommendations after using the Google Page Speed Insights.
Internal Site Search
Internal site search data can be used to improve the product inventory of your e-commerce website, collect keywords for the paid campaign, and improve the information architecture of your website. You can use internal site search data for retargeting the website’s visitors because users who use site search are likely to convert.
When working with internal site search data, always exclude (entrance) as the start page. This data doesn’t come from site search but, for example, from organic results or filtering on category pages.
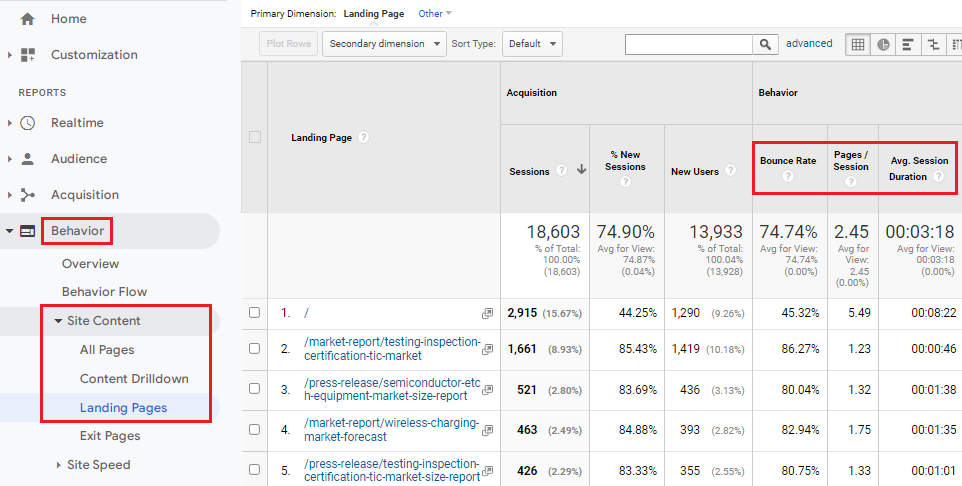
Landing Pages
Landing pages are the first pages of sessions on your website. Here, it is very important to analyze landing pages by their context. Sort your landing pages by bounce rate and use a weighted average.
So, use the Behavior group as a tool when designing and correcting website traffic logic. By helping the users get to the point they want, you are helping them buy your company’s products or services.
4. How to measure the completed action by the users of your website? – Conversion Goals
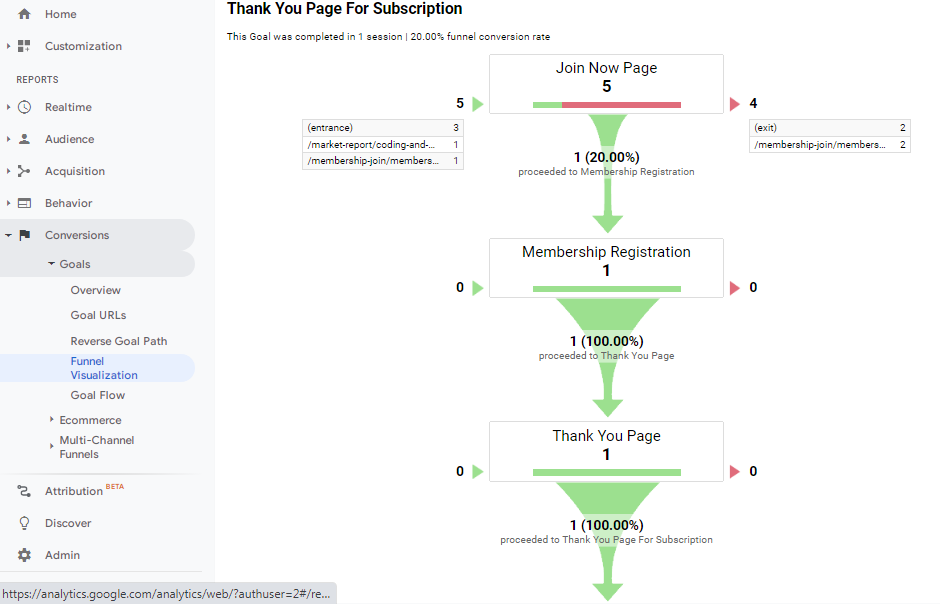
You should set goals for the important pages that you are trying to get users to visit and monitor the completion of these goals. Without this, you will not know how many users have converted.
You should aim to have at least two types of Goals. (1) Primary Goals: Your KPIs and (2) Secondary Goals: Goals that will help you to track your performance indexes to some extent. If you are to set up goals, you have it for every view. If possible, set up goals in an advanced way. You’ll be able to see funnels and the bottleneck in the user flow. Check every step of the funnel to see where users who abandoned the funnel went. It’ll help you understand why a particular stage in the funnel is a weak spot.
We can integrate Google Analytics with other tools, Google Tag Manager, where you can create custom events and goals. This feature is especially good, for example, when creating funnels.
You can track the goal completion for these touchpoints in the same way as behavior flow, but instead of just internal pages, they can be, for example, videos viewed on pages and buttons that are pressed. So with Tag Manager, you get much more accurate data on what users are doing. And more accurate data mean better optimization of strategies and better goal completion.
5. Is your website compatible on all platforms?
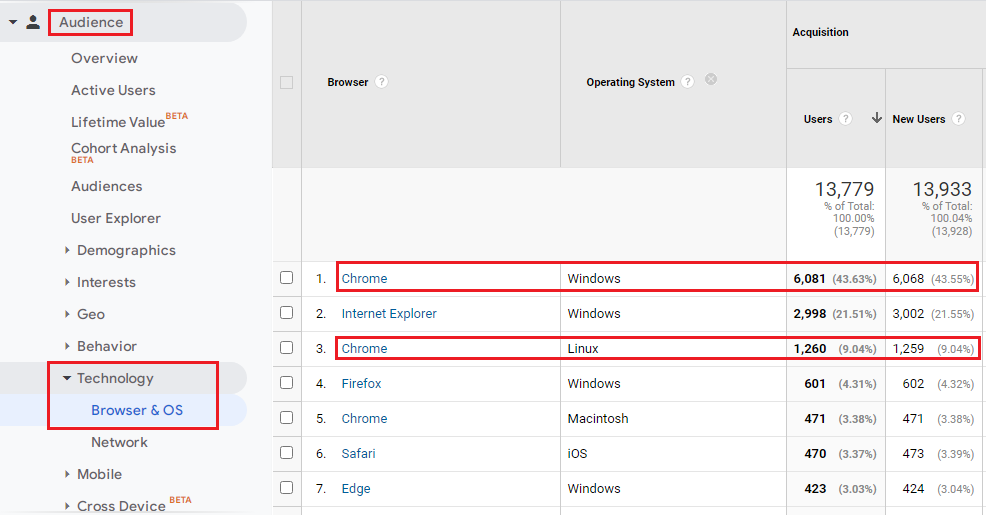
Let us assume your website looks good and works well on your computer and even on your phone. So is everything okay? Not necessarily. Your users may have different types of computers and phones, and their technology may differ widely.
The most common browsers are Chrome, Firefox, and Safari, including Opera, Edge, Internet Explorer, and several mobile browsers.
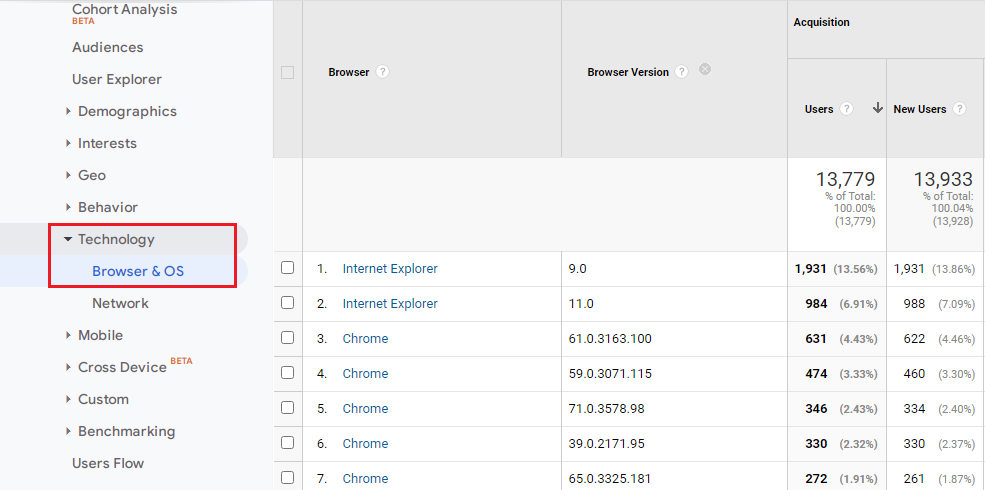
In addition, there are operating systems based on Windows, Mac, Linux as well as Android, and there are dozens of phones using these with their different versions with different resolutions. So it’s not enough that your site only works well on your devices.
If you find that a certain user group has a huge bounce rate or small session duration, consider this a big problem. These issues are often a sign of a website not working on certain platforms.
For example, the inactivity of a page’s menu bar on Android platforms may be reflected in the user’s bounce rate from the home page by more than 90% and session duration of fewer than 30 seconds. It would be best to fix this as soon as possible as you are constantly losing prospects that can bring a lot of money into your business in the long run.
6. Which of your ad campaigns worked best? – Acquisitions, Google Ads
Using Google Analytics, you’re most likely familiar with Google Ads. Google Ads users get rich data on their advertising campaigns from the Google Analytics interfaces.
The two platforms and the data points they provide can also be linked, allowing Analytics to begin displaying aggregate data. So you can learn more about your advertising campaigns.
For example, you can choose ad group keywords and site usage as table values to see how visitors who came to your site from your ads behaved, their average session duration, and bounce rate.
With this information, it’s good to start looking at the correlation between ads and Landing pages and why some pages perform.
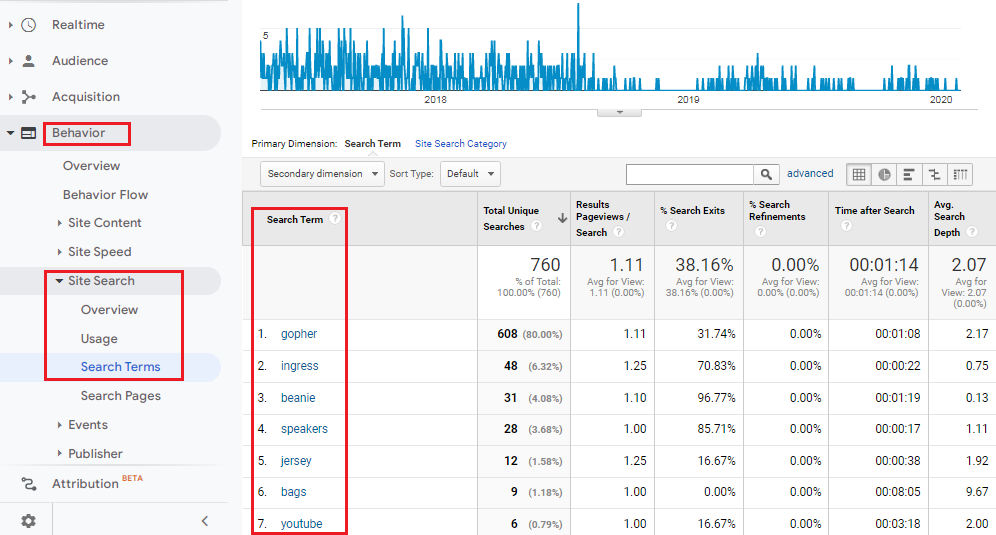
7. What do users search for on your website? – Site Search
If you have a lot of content or products on your website, not everyone will always find the most direct path to those products or content. In such cases, many use the site’s internal search feature, i.e., Site Search. And you can combine this data with Google Analytics, too.
Once you know what people are looking for on your site, you’re one step closer to being able to offer what your visitors are willing to pay for.
Identify how many users use the site search feature on your website and their conversion rate. If it works well, try to find a way to increase the number of users using it.
Check the top pages on which users start to search for something. Especially use it with secondary dimension “search term.” It tells you what exactly users were searching for on the particular page. Look at the % Search Exits metrics with weighted sort type. Now we have the search terms that you can optimize on the pages where the search terms were issued (if feasible). Also, look at the conversion rates.
Product categories may be designed poorly on your e-commerce store so that people cannot find products that they expect to be seen and therefore have to search. If you find such a problem and expand your categories based on searches, you’ll be to catch those users who didn’t use in-site search and visited your competitor’s online store.
In this case, it’s a good idea to consider whether it would be possible to put more search-related content on your pages. However, visitors were expecting to find the topic on your site, so it only makes sense to meet such demand.
8. How fast do your users leave your website? – Bounce Rate
Bounce rate should be used in contexts and should not be used as KPI. This is the percentage (%) of single-page sessions irrespective of time duration. For bounce rate get sessions with 0 (zero) minute 0 (zero) second session duration.
Ideally, visitors should stay on your website for as long as possible. Sometimes, however, your site doesn’t offer them what they want, so the visitor leaves without visiting other pages. This behavior of the visitors is defined and measured with bounce rate.
The bounce rate for web pages should be as low as possible. In other words, pages try to retain and engage their visitors as much as possible.
If any of your internal pages, especially the landing page, have a high bounce rate, you should be concerned. This high bounce rate signifies that your site is not responding to viewers’ perceptions or concerns.
Use the combination of landing page and keyword dimensions. This combination will tell if you’re taking users with particular intention to the right landing page or not. The bounce rate will help you to reach the decision. Exclude (not set) keyword.
One common reason for this is a poor marketing strategy. If Google Ads promises one certain solution and the landing page comes up with another, these messages will not correlate with each other.
Pages with tiny or no content see high bounce rates. Poor visuals, poor user experience, and distracting advertising are the reasons for high bounce rates.
Final Words
Google Analytics provides you with a huge amount of data to Analyze. However, the data itself will not help if you cannot use it creatively and make the necessary decisions.